
Lors de mes visites chez mes clients il m’arrive souvent de vérifier la configuration ASP.Net et de jeter un coup d’oeil rapide aux performances de leurs applications. Je laisse l’expertise approfondie à mes collègues PFE Développement. Hormis le mode debug activé sur au moins une application de production chez 50% des clients (pensez à bien vérifiez chez vous et à revoir vos processus opérationnels en conséquence), je collecte généralement des données de performances (idéalement sur 24 heures) via Performance Monitor (aka PerfMon). Je vous livre même ci-dessous mon script pour lancer le tout depuis une ligne de commande :
REM To create a Data Collector Set with the appropriate Performance counters for an IIS server (every 15 seconds during 24 hours)
logman create counter %COMPUTERNAME%-IIS -v mmddhhmm -o %SYSTEMDRIVE%\PerfLogs\Admin\%COMPUTERNAME%-IISPerformanceCounters -f bin -rf 24:00:00 -si 00:00:15 -c "\.NET CLR Data\*" "\.NET CLR Exceptions(*)\*" "\.NET CLR Interop(*)\*" "\.NET CLR Jit(*)\*" "\.NET CLR Loading(*)\*" "\.NET CLR LocksAndThreads(*)\*" "\.NET CLR Memory(*)\*" "\.NET CLR Networking(*)\*" "\.NET CLR Remoting(*)\*" "\.NET CLR Security(*)\*" "\.NET Data Provider for SqlServer(*)\*" "\Active Server Pages\*" "\APP_POOL_WAS(*)\*" "\ASP.NET Applications(*)\*" "\ASP.NET Apps v1.1.4322(*)\*" "\ASP.NET Apps v2.0.50727(*)\*" "\ASP.NET Apps v4.0.30319(*)\*" "\ASP.NET v1.1.4322\*" "\ASP.NET v2.0.50727\*" "\ASP.NET v4.0.30319\*" "\ASP.NET\*" "\Cache\*" "\Distributed Transaction Coordinator\*" "\HTTP Service Request Queues(*)\*" "\HTTP Service Url Groups(*)\*" "\HTTP Service\*" "\Internet Information Services Global\*" "\LogicalDisk(*)\*" "\Memory\*" "\Network Inspection System\*" "\Network Interface(*)\*" "\Paging File(*)\*" "\PhysicalDisk(*)\*" "\Process(*)\*" "\Processor Information(*)\*" "\Processor(*)\*" "\Server\*" "\System\*" "\TCP\*" "\TCPv4\*" "\TCPv6\*" "\W3SVC_W3WP\*" "\WAS_W3WP(*)\*" "\Web Service Cache\*" "\Web Service(*)\*"
REM To start the Data Collector Set
logman start %COMPUTERNAME%-IIS
Je laisse ici l’emplacement par défaut (%SYSTEMDRIVE%\PerfLogs\Admin\%COMPUTERNAME%-IIS) pour le fichier généré (*.blg) que vous pouvez bien entendu changer.
Ensuite une macro analyse avec PAL (si vous ne connaissez pas PAL je vous conseille très vivement de lire cet article) vous donnera un aperçu rapide de la performance du ou des serveurs. Mais là n’est pas le but de cet article.
J’aimerai ici me focaliser sur les exceptions .Net et leur impact sur la performance de vos applications Web/ASP.Net. Comme expliqué sur https://msdn.microsoft.com/en-us/library/ff647791.aspx (cf. Exceptions). Les exceptions CLR .NET sont observées à travers le compteur de performances “.NET CLR Exceptions, # of Excepts Thrown” (Ce compteur indique le nombre total d’exceptions générées par seconde dans le code managé). La recommandation est de rester proche de 0. Une application qui génère des exceptions peut avoir des bugs ou utiliser le mécanisme d’exceptions comme partie intégrante de la logique métier. Cette dernière utilisation est déconseillée car les exceptions sont très coûteuses et peuvent dégrader sérieusement les performances de votre application. Vous devez analyser votre code pour voir si celui-ci utilise des exceptions dans son algorithme. Response.Redirect, Server.Transfer et Response.End provoquent une exception de type ThreadAbortException dans les applications ASP.NET. Un serveur Web qui fonctionne bien ne doit pas générer d’erreurs. Examiner et corriger vos bugs avant de faire des tests de performance et surtout avant de passer en production. De plus, moins de 5 % de vos requêtes ASP.NET / sec doivent avoir des exceptions .NET (compteur de performances “.NET CLR Exceptions, # of Excepts Thrown / sec”). Si vous voyez plus de 1 requête sur 20 lancer une exception, vous devez investiguer. Et c’est précisément sur ce dernier point que je vous propose un script PowerShell qui analysera vos fichiers de performances (*.BLG) et vous indiquera quand le seuil de 5% d’exceptions ASP.Net est dépassé (toutes applications confondues). Vous n’êtes pas obligés d’utiliser le jeu de compteurs que j’ai spécifié plus haut mais il faut au moins que les compteurs suivants aient été collectés :
-
.NET CLR Exceptions(w3wp*)\# of Exceps Thrown / sec ou .NET CLR Exceptions(*)\# of Exceps Thrown / sec
-
ASP.NET Applications(*_LM_W3SVC_*)\Requests/Sec ou ASP.NET Applications(*)\Requests/Sec
Le code source est disponible ici.
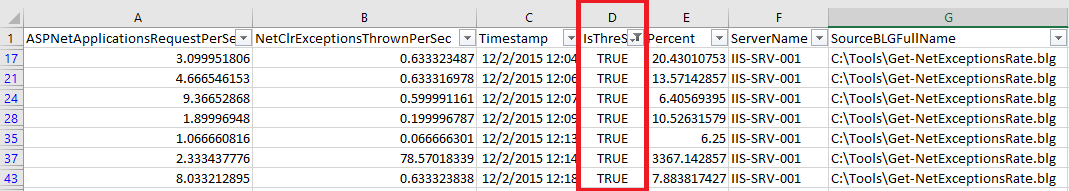
Ensuite vous avez la possibilité de trier sur la colonne D (IsThreSholdExceeded) pour ne garder que les intervalles de temps où le seuil est dépassé (valeur True).
During my customer visits I often check the ASP.Net configuration and take a quick look at the performance of their applications. I let the deep expertise to my colleagues PFE Development. Apart debug mode enabled on at least one production application in 50% of customers (remember to check your applications and review your business processes accordingly), I usually collect performance data (ideally 24 hours) via Performance Monitor (aka PerfMon). Below I give you my script to start all from a command line:
REM To create a Data Collector Set with the appropriate Performance counters for an IIS server (every 15 seconds during 24 hours)
logman create counter %COMPUTERNAME%-IIS -v mmddhhmm -o %SYSTEMDRIVE%\PerfLogs\Admin\%COMPUTERNAME%-IISPerformanceCounters -f bin -rf 24:00:00 -si 00:00:15 -c "\.NET CLR Data\*" "\.NET CLR Exceptions(*)\*" "\.NET CLR Interop(*)\*" "\.NET CLR Jit(*)\*" "\.NET CLR Loading(*)\*" "\.NET CLR LocksAndThreads(*)\*" "\.NET CLR Memory(*)\*" "\.NET CLR Networking(*)\*" "\.NET CLR Remoting(*)\*" "\.NET CLR Security(*)\*" "\.NET Data Provider for SqlServer(*)\*" "\Active Server Pages\*" "\APP_POOL_WAS(*)\*" "\ASP.NET Applications(*)\*" "\ASP.NET Apps v1.1.4322(*)\*" "\ASP.NET Apps v2.0.50727(*)\*" "\ASP.NET Apps v4.0.30319(*)\*" "\ASP.NET v1.1.4322\*" "\ASP.NET v2.0.50727\*" "\ASP.NET v4.0.30319\*" "\ASP.NET\*" "\Cache\*" "\Distributed Transaction Coordinator\*" "\HTTP Service Request Queues(*)\*" "\HTTP Service Url Groups(*)\*" "\HTTP Service\*" "\Internet Information Services Global\*" "\LogicalDisk(*)\*" "\Memory\*" "\Network Inspection System\*" "\Network Interface(*)\*" "\Paging File(*)\*" "\PhysicalDisk(*)\*" "\Process(*)\*" "\Processor Information(*)\*" "\Processor(*)\*" "\Server\*" "\System\*" "\TCP\*" "\TCPv4\*" "\TCPv6\*" "\W3SVC_W3WP\*" "\WAS_W3WP(*)\*" "\Web Service Cache\*" "\Web Service(*)\*"
REM To start the Data Collector Set
logman start %COMPUTERNAME%-IIS
I keep here the default location (%SYSTEMDRIVE%\PerfLogs\Admin\%COMPUTERNAME%-IIS) for the generated file (* .blg) you can of course change.
I would like here to focus on .Net exceptions and their impact on the performance of your Web / ASP.Net applications. As explained on https://msdn.microsoft.com/en-us/library/ff647791.aspx (cf. Exceptions).
The .NET CLR Exceptions are observed through the “.NET CLR Exceptions, # of Excepts Thrown” performance counter (This counter indicates the total number of exceptions generated per second in managed code). The recommendation is to stay close to 0. An application which generates exceptions can have bugs or use the exception mechanism to manage application. This last use is not recommended at all because exceptions are very costly and can severely degrade your application performance. You should investigate your code for application logic that uses exceptions for normal processing behavior. Response.Redirect, “.NET CLR Exceptions, # of Excepts Thrown” and Response.End all cause a ThreadAbortException in ASP.NET applications. A well-functioning Web server should not generate errors. If errors occur in your ASP.NET Web application, they may skew any throughput results because of very different code paths for error recovery. Investigate and fix any bugs in your application before performance testing. In addition, no more than 5 percent of Request/sec for the ASP.NET application has to be .NET exceptions (counter “.NET CLR Exceptions, # of Excepts Thrown / sec”). If you see more than 1 request in 20 throw an exception, you should pay closer attention to it. And it is precisely on this last point that I propose a PowerShell script that will analyze your performance files (* .BLG) and tell you when the threshold of 5% of ASP.Net exceptions is exceeded (for all applications). You are not obliged to use the set of counters that I specified above, but you need at least to collect the following counters:
- .NET CLR Exceptions(w3wp*)\# of Exceps Thrown / sec or.NET CLR Exceptions(*)\# of Exceps Thrown / sec
- ASP.NET Applications(*_LM_W3SVC_*)\Requests/Sec or ASP.NET Applications(*)\Requests/Sec
The source code is available here.
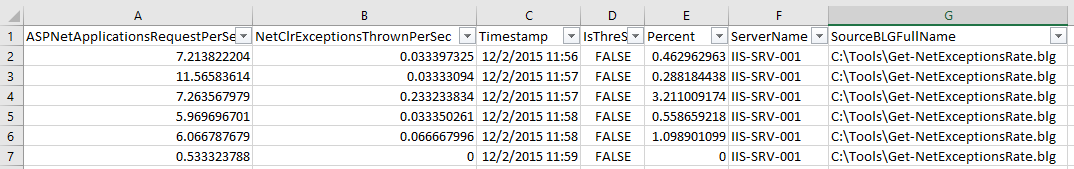
The result will be a CSV file as shown below:
Then you have the ability to sort the column D (IsThreSholdExceeded) to keep only the time intervals in which the threshold is exceeded (value True).
Laurent.